Fuel Tank and Battery Pack Sizing
In 2010, the F1 regulations changed so that there would be no in-race refueling. For the first time in decades, the cars would have to carry all the fuel necessary to make it through a race. It sounds like a fairly mundane and straightforward issue to figure out, but one team got it wrong with severe results. Wirth Research had been signed on to design and supply a car for the Virgin F1 team. However during early season testing and the first race it became clear that the fuel cell was too small.
https://theparcferme.com/virgin-missing-12-liters-how-is-that-possible/
Two other teams used the same Cosworth powerplant, so you couldn’t really blame the engine supplier.

ATL-F1-Fuel-Bladder CC-SA-4.0, via Wikimedia Commons
It sounds like a simple mistake, but there are a fair number of assumptions that have to go into sizing. But first, let's study the tradeoffs.
Too big:
Carry too much fuel, or battery
Extra weight
Wasted valuable space
Near CG
Bigger MOI
Usually trying to package a lot of accessory items in this space
Other items may have to move elsewhere
Constrains aero envelope
Too small:
You run out of fuel/energy and don’t finish the event or lose positions driving slowly
Looks bad to the observers
Lose sponsorships
Fail class
Lose job/work
Maybe we should target a little on the safe side. With small capacity engines running on a fairly low speed track and an air restrictor, fuel consumption should be pretty small and at ~6.3 lbs/gallon the weight penalty isn’t very huge. However, on an electric vehicle the mass density is much worse and so the energy calcs should take a much higher priority.
Because of the usual location of the fuel tank and/or the size and weight of battery cells, this calculation should happen early on in the design process. Expanding a fuel cell or adding more battery cells will have costly knock-on effects that may require the re-design (and manufacture) of other systems.

Production based racecars end up with large capacity fuel cells in compromised locations due to series, safety and packaging requirements.
Porsche GT3 Fuel Tank by Bill Abbott, via Wikimedia Commons
So how do we determine the fuel tank size if we’re entering a “new formula” or have little past information to look back on? The coarse option would be to take an estimate at your brake specific fuel consumption (BSFC), your average power requirements and the amount of time needed to complete the longest event. I’m not a huge fan of this route as we have to make multiple assumptions without any concrete data and brake specific fuel consumption (BSFC) actually changes with RPM and load. In this case we’d unfortunately have to have a large factor of safety in our design.
That being said, since FSAE cars have a relatively low power output and gasoline is fairly energy dense, a large factor of safety may not be a huge detriment and this coarse calculation will get you in the ballpark.
With that in mind, batteries (on FSAE electric vehicles) are much less energy dense and have larger packaging requirements. And other forms of motorsport are much more sensitive to fuel tank sizing and fuel mass. So the exercise with appropriate data is still applicable..
Brake specific fuel consumption is defined as the rate of fuel consumption divided by the power output; with units of lb/hr or kg/J.
If we put the engine on the dyno, we can build our BSFC map. We could also build most of it from on track testing data. With a calibrated fuel injector pulse and doing a “pull” through the engine speed range we can generate a 2-D graph showing fuel used vs engine speed at full load. The same can be done with electric vehicles if you’re able to measure the current leaving the battery packs.
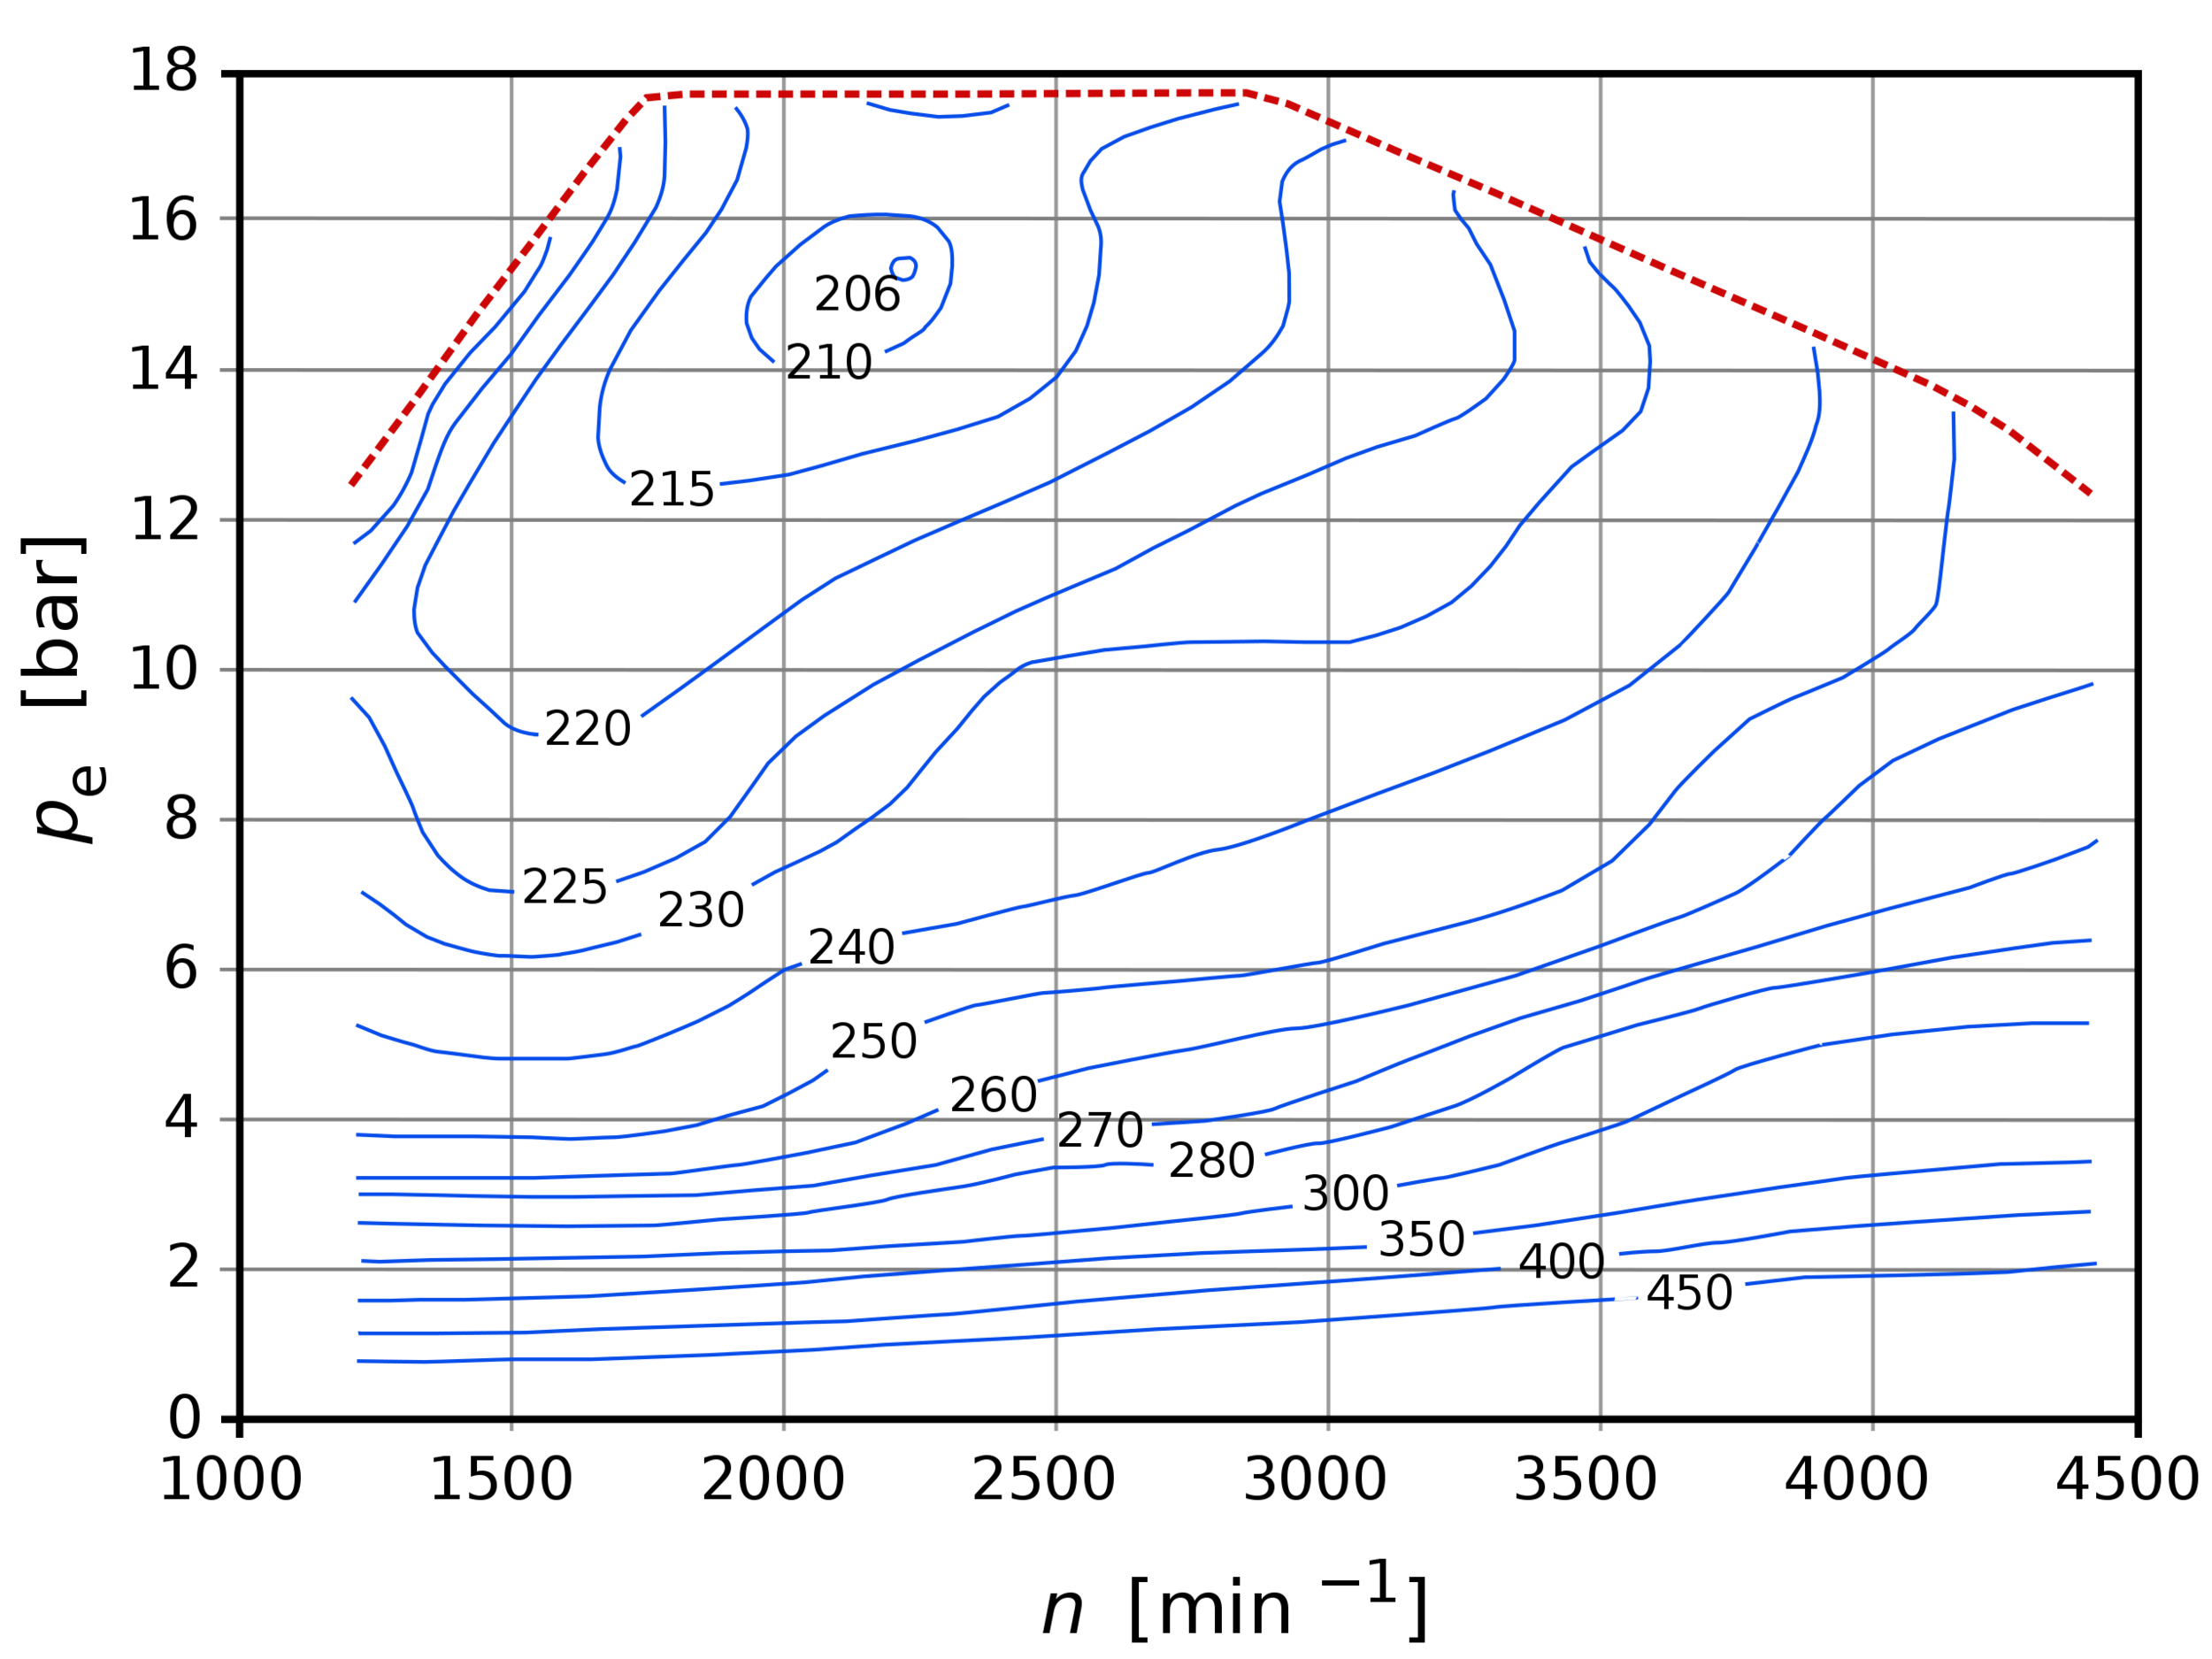
The contour lines on the graph show BSFC in g/(kW h) for varying engine speeds and loads.
We can see inefficient values at part load due to pumping losses, and also note that BSFC varies at full load for different engine speeds.
Example BSCF by Steffen Digeser, Mario Erdmann, Franz-Paul Gulde, Thomas Mühleisen, Joachim Schommers, Roland Tatzel, via Wikimedia Commons
So, what factors influence BSFC?
Essentially, it’s a question of how efficiently the engine uses the fuel and some of that comes down to how efficiently we can fill the combustion chamber with oxygen molecules. A reduction of mechanical losses (friction) will generally improve the overall map. Combustion efficiency, including ignition timing and air/fuel ratio, and compression ratio will do the same. Other areas such as cam timing, and intake/exhaust runner length will move the efficiency points around as there are trade offs in these systems. Similarly the fuel injector distance from the intake valve is a tradeoff for fuel atomization/creating a homogenous mixture of air and fuel based off of engine speed. Any intake restriction will create pumping losses which will also lower the BSFC. Because of these reasons, the BSFC for a stock engine will not match that of one installed into an FSAE car.
Back to the FSAE example: we know the total length of the endurance event, and looking at past information or doing some research, we can come up with a general course outline. If you have the capabilities for putting the track map and your engine model into a simulation program, you can come up with a pretty accurate number. But lacking that, coming up with the number and length of straight sections of track and an approximation of throttle opening for each turn should produce a number more accurate than our initial coarse calculation. From this calculation, you’ll probably want to add a factor of safety as you won’t be able to pick up all the fuel from the fuel tank/run a battery pack all the way down to zero energy; also components inside the tank displace fuel, colder ambient temperatures increase fuel consumption, a better car/driver would lead to more time on throttle, etc. A good study and understanding of the numbers will help you arrive at a reasonable factor of safety.
Teams with properly logged data can plot engine load versus engine speed from testing or previous events. This data can be compared to the BSFC maps to help guide in fuel consumption calculations or provide direction for engine tuning. By taking the amount of time spent at each data point and multiplying that by the corresponding BSFC and power made at that time will provide the mass of fuel used.

Engine Load Vs Engine Speed Data Taken From a Single Lap on a GT3 Racecar
Electric vehicles may have more of an iterative process, as the weight of the cells will have a much larger effect on the total mass of the vehicle, which then affects the performance and range. Below are efficiency graphs related to electric vehicles; contour lines denote energy efficiency instead of BSFC.
With AC drive motors we can separate out the efficiency of the inverter and motor. These numbers need to be multiplied to obtain the brake specific efficiency of the system. Note that while maximum torque for an electric motor occurs at low speeds, this does not occur in the most efficient operating range.

For vehicles using motors to regenerate energy, we can produce a drive and regen map. Note that these contour lines don’t necessarily need to be symmetrical across the x-axis.

In general, this calculation tends to err on the side of safety as the issues arriving from too much capacity are significantly less consequential than those of too little capacity. Keep in mind that these numbers do not take into account drivetrain losses or other energy consumption from accessories. Reducing the factor of safety depends on how good your information is going into your calculations; and while younger teams will not have good data to use, a rough calculation needs to happen early on in the vehicle design process.