Four Ways To Use Data
Judges love data. I admit, I had heard this repeated constantly in FSAE but didn’t really get why at first. But eventually it clicked. Design judges don’t need you to prove that you built a good car -- dynamic events are the ultimate measure of that. They want you to use data to understand your vehicle for your own team’s sake -- to improve engineering decisions throughout the whole design cycle, from design to test. Here are four ways data can help your team out.
1. Defining Requirements
Ever find yourself with an FEA model all meshed up but you don't know what loads to apply? Don’t know what temperature a part needs to survive? Or don’t know the steering wheel angle the driver prefers? You could do some research, use a rule of thumb, or take a wild guess, but the most direct and accurate method is to measure it yourself. Here are some tips:
Measure last year’s design to provide a baseline, then predict how the requirement might change for next year. For example, if you’re interested in designing a radiator duct but don’t have a mass flow rate to target, measure the mass flow to the current radiator then consider how the engine cooling requirements may change with next year’s engine mapping.
Make scale models or rough prototypes to collect data on a brand new design.If last year’s car won’t do, mock up a critical part of next year’s design to test it. For example, if you’re changing battery cells and want to know the cooling requirements of the new cells, you don’t need to build the whole pack. Instead, put a couple cells in a representative enclosure and measure temperatures.
Don’t be afraid to estimate, heavily. Some requirements don’t lend themselves to being measured. But most of the time, it’s still worth trying. If the alternative is no data, at least measure something to give you a ballpark figure. Chances are, you’ll learn something on the way. If you can’t get absolute values, try to at least understand a sensitivity. Or try to bound the result by identifying the lowest and highest possible values.
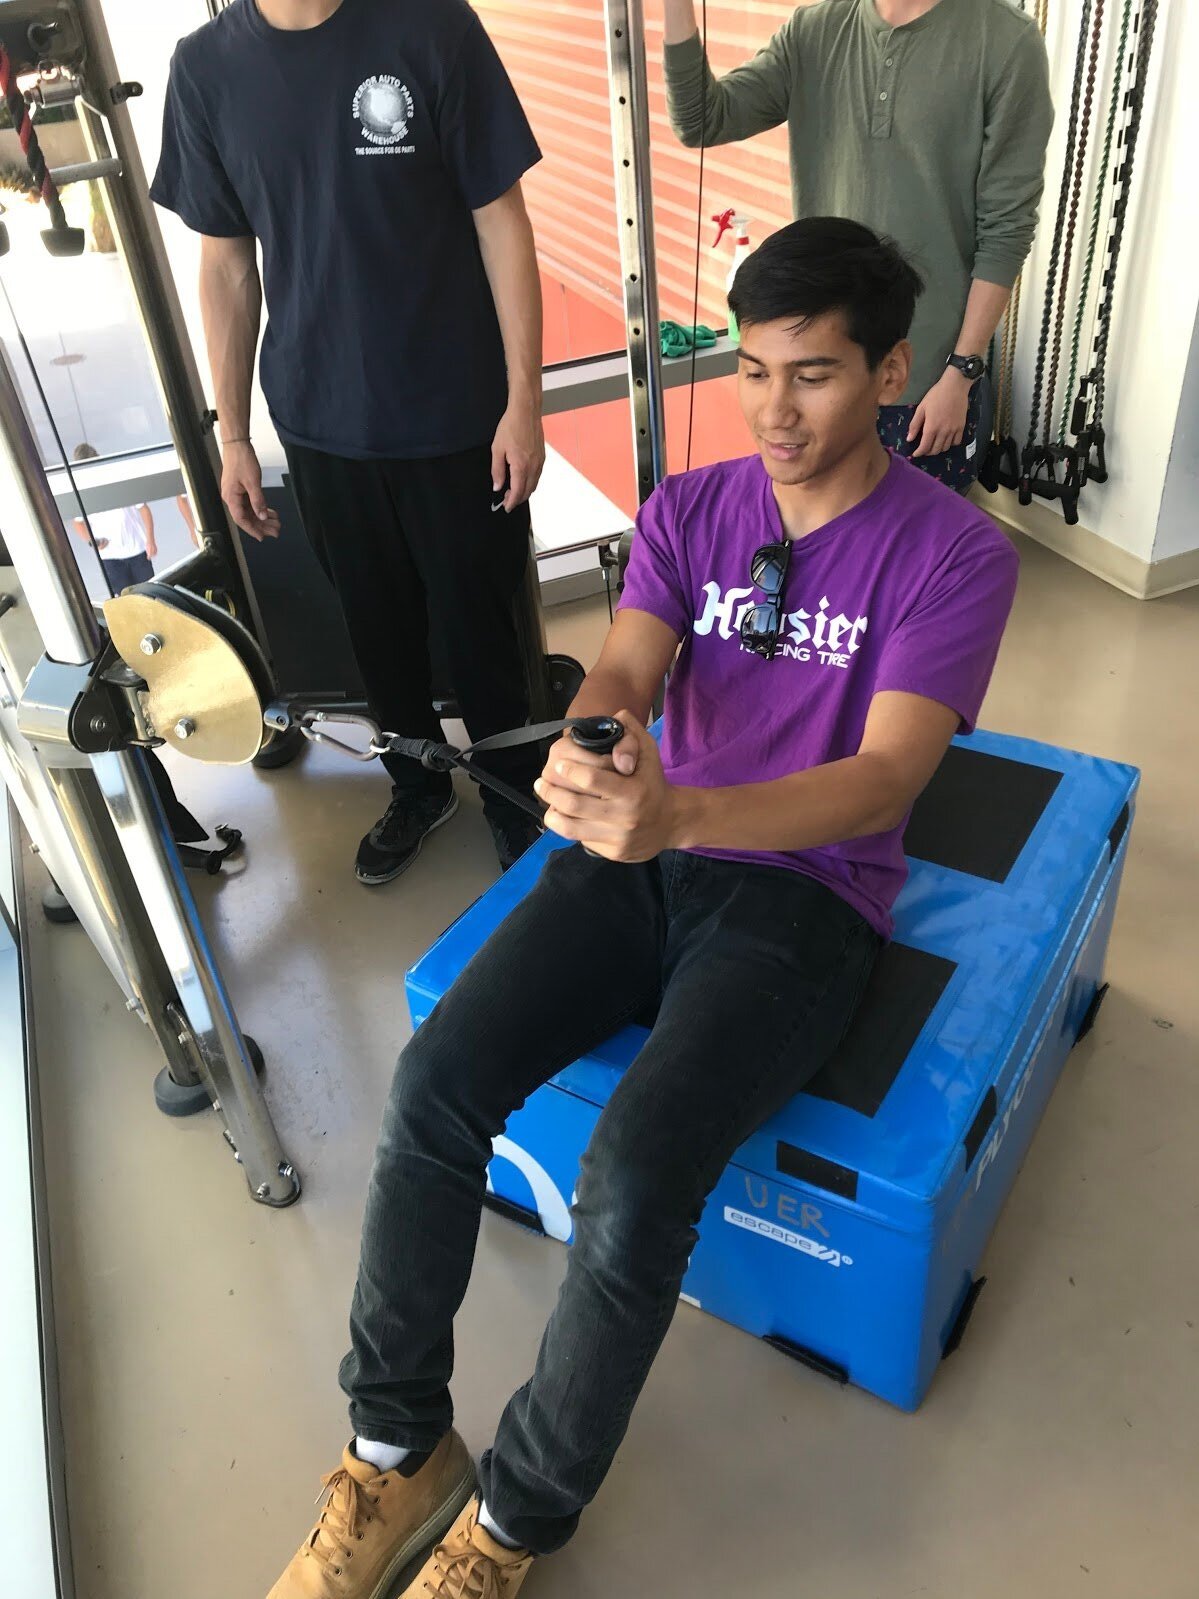
Calculating steering torque from tire data and steering geometry is easy enough, but what about the out-of-plane loading on the steering wheel? Students at Cal Poly, SLO went to the rec center to measure the bending force a driver could exert on the steering wheel.
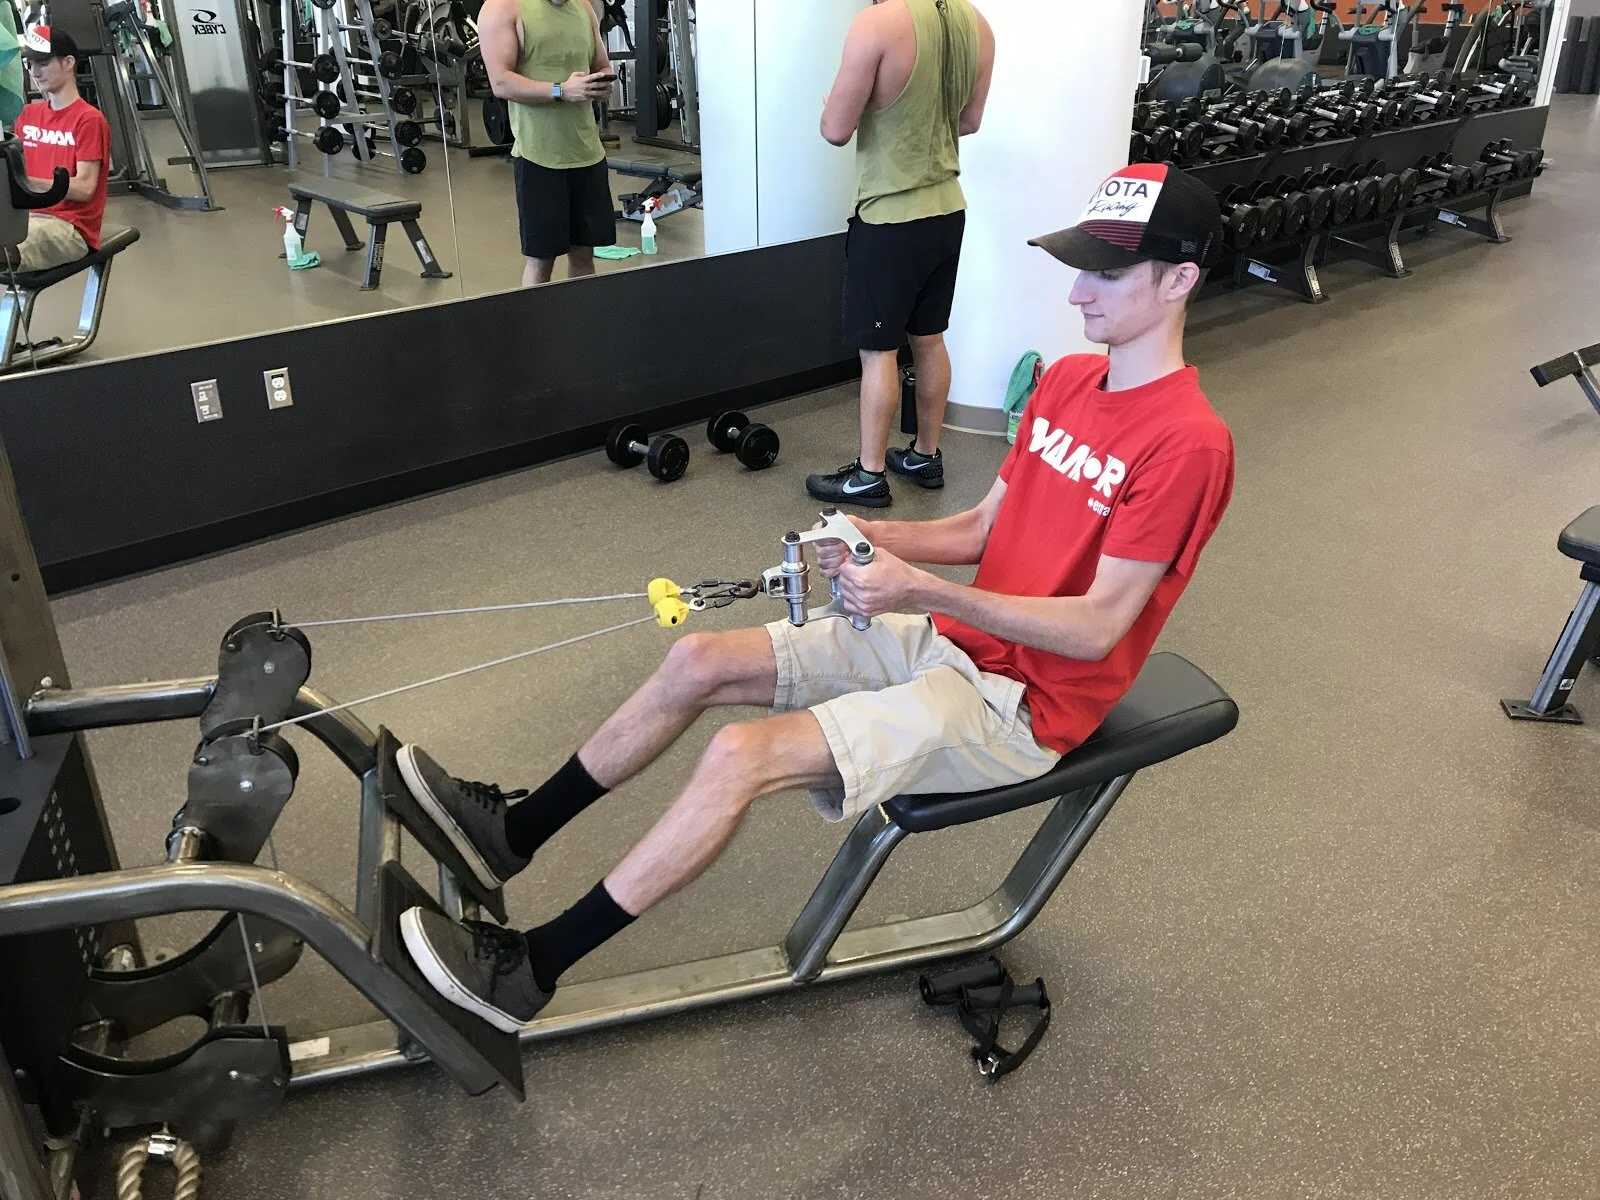
Pictured are Donovan Zusalim, driver controls lead, and Tommy Bordeaux, business lead and driver, 2018. Photo credits Camden Boshart.
2. Validating Models
Looking for a way to make sure you set up a model correctly? That you plugged in your parameters correctly… in the correct units? And that you have the correct amount of sign errors to make the results sensible? All models have some amount of error and all data has some amount of measurement uncertainty. Comparing the two adds value to both. Validation allows you (and the design judges) to gain confidence in your model and the decisions you made using it. But validation isn't only for checking your math -- it's also a useful check of your assumptions. In many cases, you don’t need hundreds of DOFs, heavy computation, or software you have to pay for -- if you can prove that a simple model accurately predicts vehicle behavior in a certain operating condition, you’re in business. How do you conduct this comparison if you haven't built the car yet? Use data from last year's car. If you tune the model to match one vehicle, you can confidently make predictions about another.
How exactly do you validate your model?
Put the real-life vehicle (or component) and the model through the same test case, plot the results together, then play spot-the-difference. Here are some tips:
Prioritize measuring vehicle parameters. Your models are only as useful as the data you give them, so having an accurate measurement of vehicle properties is critical. Below are some major ones for full-vehicle modeling, for example:
Mass properties (CG, inertias, mass)
Aero properties (drag, downforce, center of pressure)
Suspension & steering properties (kinematics, compliances, ride/roll rates, damper rates, tire data)
Powertrain properties (diff locking & preload, torque curve)
Chassis properties (torsional stiffness)
You may be able to predict some of these with other models (i.e. CFD, FEA, kinematics solvers, mass calculators), but those are all models deserving of validation as well. In some cases, you can actually use your full-vehicle model to validate vehicle properties. For example, if you have a simple bicycle model with n vehicle parameters and you know n-1 of those parameters with high confidence (mass, wheelbase, you’ve validated your tire models in a separate test), you could start with a guess for the nth parameter (maybe yaw inertia) and adjust it until the model matched the data.
2. Meticulously record test details. This includes vehicle set-up and ambient conditions. Run through your model ahead of time to make a list of everything you’ll need to record for use later.
3. To best understand correlation, give the model inputs recorded from the test session. For example, if you’re validating a bicycle model, use the on-vehicle measured steer trace as the input to your bike model to eliminate variation between the driver’s actual input and an idealized model input.
4. Use statistical analysis of data from multiple runs. When comparing model results to data, it’s important to distinguish between model inadequacy and variation inherent to the test. Try to record enough data to calculate a mean, standard deviation, and confidence interval for the test results and plot these against your model to understand better where your model is and isn’t reliable.
What do you look for in a correlation exercise?
Did I do math right?Units, sign errors, algebra, accidentally erasing the dot off the top of yaw acceleration and getting yaw rate (happens to the best of us).
Are my vehicle parameters correct?Different models require different levels of accuracy in vehicle parameters. For example, if you’re performing a sensitivity study, you may be able to tolerate more uncertainty than if you are trying to predict absolute values.
Are my assumptions correct?
Is my low-fidelity model sufficiently accurate in this operating condition?
If not, what effect seems to be missing? Under what conditions does the model fall short?
Can I empirically derive a “fudge factor”?

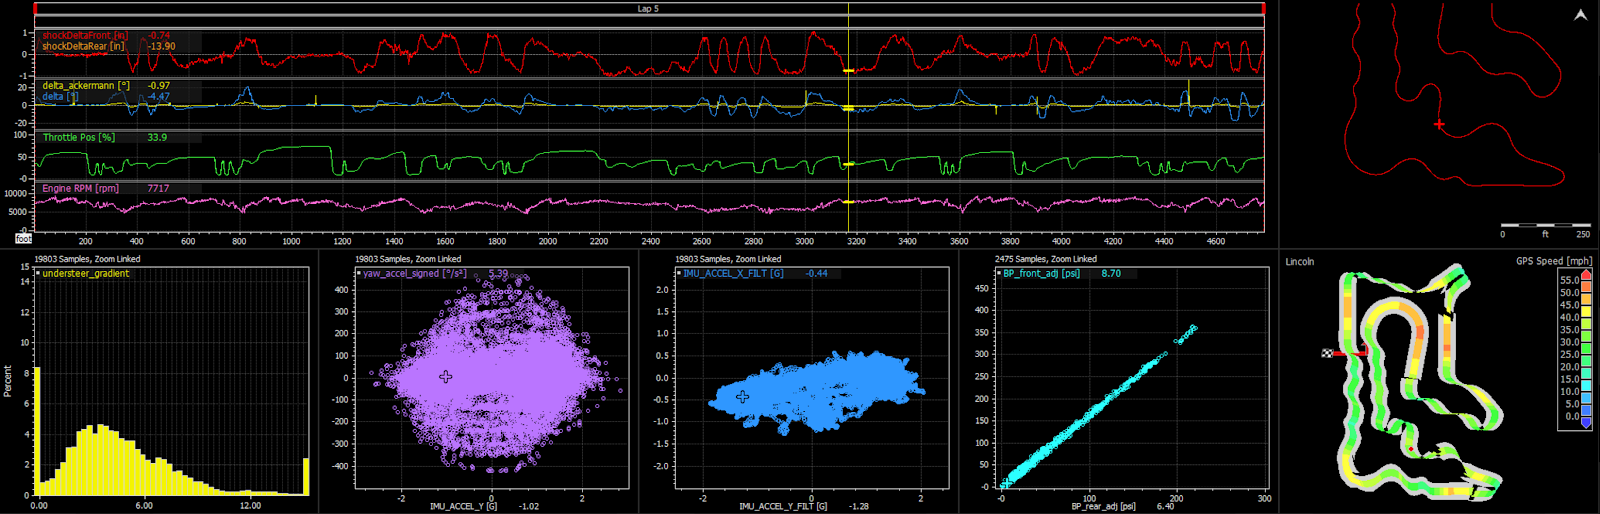
Measured steer angle through a short section of track was used as the input to this bicycle model, then yaw rate and lateral acceleration were compared with vehicle results. The comparison shows that this model is only valid in the linear range of the tire -- the model over-predicts yaw rate and lat acc for large tire slip angles.
3. On-car tuning
Even the most validated models stop short of making a perfect car. A non-negligible part of going fast is making the car easy for a human to drive. That, among a myriad of other aspects of vehicle performance, is complicated and difficult to model, so on-car tuning is vital. Here are some tips for efficient tuning:
Lap times aren’t everything. If you want to understand the vehicle’s sensitivity to a tuning change, set up test events that are:
Discrete.Isolate out a single operating region, i.e. use a skidpad test to understand steady-state cornering; use a slalom or sharp turn to look at roll damping. This gives you highly concentrated data for the parameter you’re trying to tune.
Repeatable. Choose highly defined test cases that are easy for the driver to perform consistently, i.e. set up a few turns instead of a whole course. Give the driver some practice before you start acquiring data.
Lastly, always check your changes in a competition-style event (i.e. mock autocross) periodically to make sure that the tests you set up are a good representation of vehicle operation on a full course.
Conduct multiple runs. Measurements from even the most repeatable tests will contain error from a variety of sources (variation in driver inputs, ambient conditions, sensor noise/resolution, etc.) Repeating tests allows you to apply statistical methods and gain confidence in the correlation between your set-up change and the resulting vehicle behavior.
Choose consistency over speed.To produce good data as a driver, try to be as consistent as possible. This may not be the fastest and that's okay. Focus on delivering uniform inputs to the vehicle (steer, throttle, brake) instead of producing a uniform vehicle response, especially if you're running multiple setups that will change vehicle behavior.
Practice good data organization.Even if it means a slower testing pace, take time between each test to record information in a run log, including:
Set-up change made
Driver feedback
Anomalies in the test procedure (Did the driver make an error in a maneuver? Did you run an extra lap?)
Changes in ambient condition or vehicle condition (Were the tires colder after one setup change than another?)
Store all your team’s data, along with the run log, in a central location accessible by the whole team. Data recorded one year can be a valuable tool for years.
4. Understanding the root cause of problems
If the car or a component isn’t performing as expected, collecting data can help you get to the bottom of it. Say, for example, your car oversteers more going right than left. Here’s a general procedure for race car forensics:

Characterize the Issue: Understeer gradient is clearly different between right and left skidpad tests.
1. Characterize the issue. If the driver reports asymmetric handling, take some data to confirm the problem exists and to understand the magnitude. To objectively measure lateral balance, conduct some skidpad tests and compare data (understeer gradient, lateral acceleration, etc.) between right and left directions. (If you don’t have a bunch of sensors on the car, try pictures or videos instead.)
2. List all the factors that can influence the particular attribute you’re trying to troubleshoot. In this example, handling balance can be affected by:
Tires (uneven performance)
Alignment
Corner weights
Anti-roll bar and spring preload
Aero performance
Suspension & steering geometry (Ackermann, camber gain, bump steer, roll center migration, caster, etc.)
Stiction or binding of suspension
3. Investigate the potential causes.Using the same list as before:

Investigate Potential Causes: Bump steer is clearly outside of specification on the front left wheel.

Further measurements found crooked steering rack mounting to be the root cause.
Rotate tires and check if the problem persists.
Check alignment (camber, caster, toe). Are there flaws in your alignment rig?
For both corner weights and alignment, floor flatness can influence results. Try shimming the wheels or scales with a level or measuring the car in different orientations on the ground.
Check that you have equal preload right to left in your anti-roll bar links and spring perches. It’s also worth checking that you have matching wheel rates right to left. (You can do this by placing a bottle jack on a scale and incrementally raising the wheel, measuring force and displacement along the way.)
Steering the front wheels and yawing the car can both have a big effect on aero performance. You can use flow visualization or tuft testing to quickly check that your aero elements are working properly when you turn both directions.
You can measure suspension points and compare to CAD, but it’s often easier to measure the kinematic attribute instead. These measurements require a bit of creativity, but the results are always enlightening.
If you didn’t catch a stiction or binding issue in your kinematic or rate measurements, try mounting a camera on various suspension components while driving to capture suspicious activity on film.
4. Whenever you get the opportunity, record data. Good data acquisition is not always easy, but when you clear this hurdle, the rest will come automatically. Opportunities to improve performance on this year's car will jump out at you from the data. And if properly stored, data on one year's car will serve as a bank of critical information to drive design decisions on future cars. But most if all, when you collect data you can't help but learn from the vehicle.
Esther Unti is a senior vehicle dynamics engineer at Lucid Motors. Her focus is on vehicle test, data analysis, and low degree of freedom modeling. Prior to graduation in 2018 (BSME), she was the technical director of the Cal Poly Formula SAE electric and combustion vehicles. Esther is a mentor to the San Jose State and Cal Poly SLO FSAE teams and to anyone willing to listen to her wax poetic about tires. When she's not working on cars at work or working on cars at home, she's outside hiking or biking.